Climate Change: Winners and Losers
Lesson 2: Earth's Climate History
Page 1: The Hockey Stick Page 2 Page 3 Review
The Hockey Stick
Our story so far: Humans have been adding greenhouse gases to our atmosphere--mostly carbon dioxide (CO2) and methane (CH4), but also nitrous oxide (N20) and chlorofluorocarbons (CFCs). These greenhouse gases trap heat and warm the atmosphere, which in turn raises surface temperatures around our planet.
How hot is Earth likely to get within the next hundred years or so? It is difficult to answer this question because so much depends on the amount of greenhouse gases that we add to our atmosphere during this time.
Still, scientists try predict future temperatures by using computers to model different possibilities. Remember that even if we immediately stopped putting any more greenhouse gases into the atmosphere, we would still experience an increase in temperatures because CO2 remains in the atmosphere for a long time. Even if we immediately stopped adding new greenhouse gases, most models predict that average surface temperatures would increase by at least 1.1ºC (2ºF) by the year 2100. If we keep adding greenhouse gases at the same rate that we are adding them now, temperatures would likely increase at least 4.5ºC (8ºF).
Of course, if we increase the rate at which we add greenhouse gases, temperatures will get even higher.
Here is a graph of average surface temperatures on Earth over the past 1,000 years:
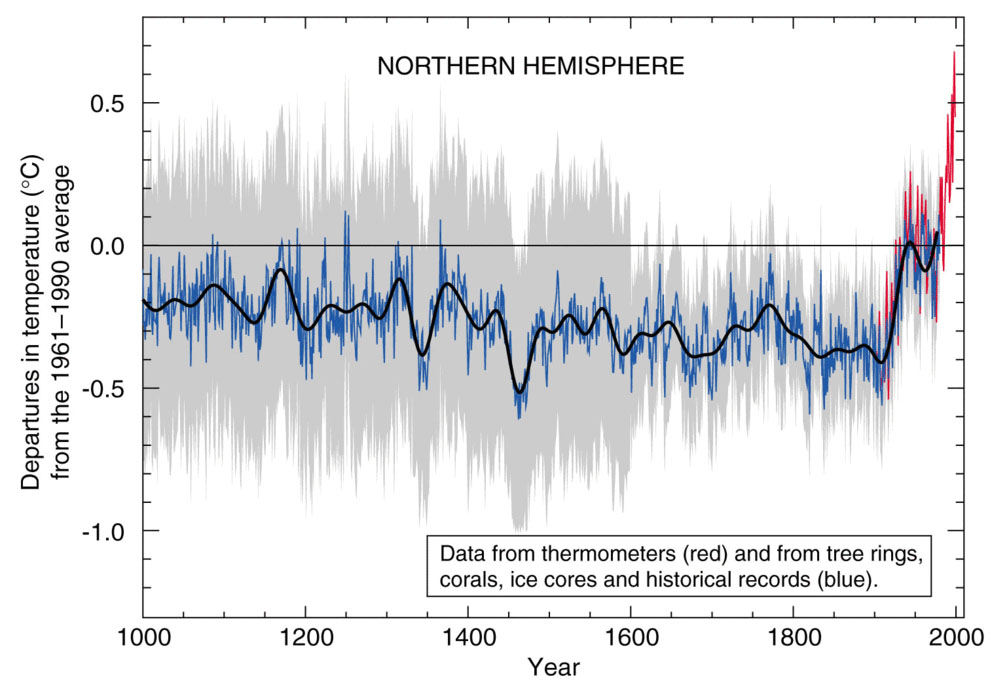
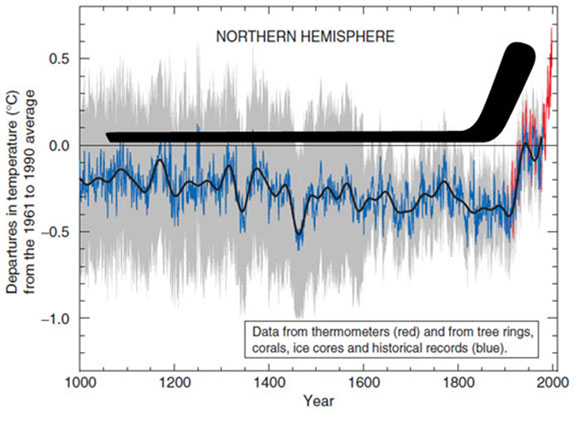
On this graph, the line at 0.0 represents the average surface temperature between 1961 and 1990. This graph is often called the "Hockey Stick Graph" because the overall trend is said to resemble a hockey stick:
The graph shows that from 1000 A.D. up until about 1900 A.D., overall average temperatures were pretty stable, perhaps cooling very slightly. After 1900 they began increasing rapidly. It looks pretty alarming. This prolonged, rapid increase has never happened before within the past 1,000 years.
But 1000 years is only about 2/10,000,000, or 0.0000002% of the age of our planet. What about the other 99.9999998% of Earth's history? It turns out that things get really interesting when we take a longer-range look at temperature changes on Earth.
Go to Page 2