Climate Change: Winners and Losers
Lesson 2: Earth's Climate History
Page 1 Page 2 Page 3: Hothouse/Icehouse Earth ReviewHothouse/Icehouse Earth
On Page 1 we looked at 1,000 years of Earth's climate history. Page 2 reviewed the past 800,000 years. Now we are going to examine the past 1 billion years, which is roughly 21.5% of Earth's history. Things start getting a little weird when we look at global temperatures over such a long time span.
Here is a graph of the climate history of the past 1,000,000,000 years:
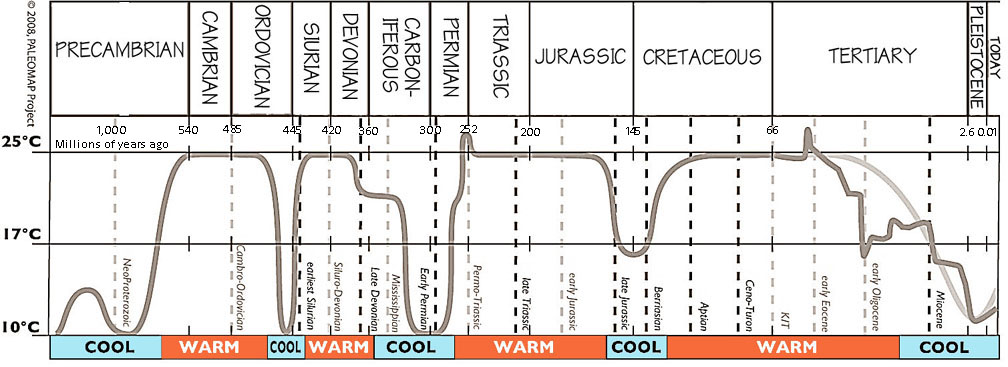
The two earlier graphs (Page 1, Page 2) that showed how much temperatures varied from an average. The line in this graph shows actual temperatures. However, it is not possible to show the same amount of detail over this much time. This line is showing long-term climate trends.
Over the past 1 billion years, average global temperatures have varied from 10ºC to 25ºC (50ºF to 78ºF). There have been periods in Earth's history when temperatures have been much cooler than they are now. Some of these cool periods have lasted for millions of years. Scientists call these cool periods Icehouse Earth. Many scientists suspect that there have been a few times in Earth's past that global temperatures were so low that most, or even all, of the surfaces of the oceans froze over and the planet was covered in ice. This hypothesis is known as the Snowball Earth hypothesis.
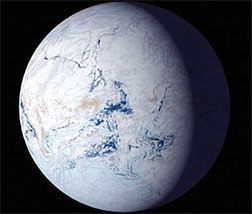
While not every climate scientist accepts that all the oceans froze, just about all are in agreement that there were long stretches in Earth's history when the planet was much cooler than it is today.
There were also periods lasting for millions of years when Earth was much warmer than it is today. During much of these warmer periods there were no ice caps at the poles. Temperatures were summer-like over most of the globe. These long, warm periods are called Hothouse Earth, or sometimes Greenhouse Earth. These are much longer time spans than the interglacial phases that you saw on the previous page.
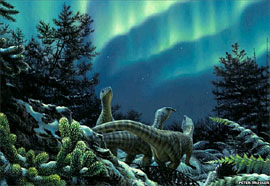
During the later Cretaceous--a Hothouse Earth time--even Antarctica had mild temperatures and supported abundant plant and animal life. Notice the two temperature "spikes" on the graph, one at the end of the Permian and one in the early Tertiary. Although they look like very brief events, both probably lasted for tens of thousands of years.
If you look at the right end of the graph at the top of this page, you will notice that we are now in an Icehouse Earth period. Yet glaciers are in retreat, and temperatures are rising. This is not unusual. Even during times of Icehouse Earth there were interglacial phases, times when temperatures rose and the glaciers slowly went away. So we are now in an interglacial phase, a somewhat warmer phase, of Icehouse Earth.
You may recall from Lesson 1 that today, Earth's average surface temperature is around 15ºC (59ºF). During Hothouse Earth average temperatures were around 25ºC (78ºF), and sometimes as high as 30ºC (86ºF). If we continue adding greenhouse gases to our atmosphere at the same rate we are now, scientists predict that global temperatures will rise by as much as 4.5ºC (8ºF) by the end of the century. This is still well below temperatures during hothouse Earth periods. Yet life thrived during many of the hothouse periods.
So is the CO2 that we put into the atmosphere going to destroy the planet? No.
Is it going to wipe out all life on Earth? No.
Then why do we need to worry about this? Because global warming, and the climate changes that it provokes, are going to pose some profound challenges for many of the animals that live on our planet. And one of the animals that will probably face some of the greatest challenges is us. We will look at some of the challenges that we are creating for our future selves in the next lesson.
Go to Review